|
|
 |
 |
|
|
|
 |
|
|
|
|
|
 |
|
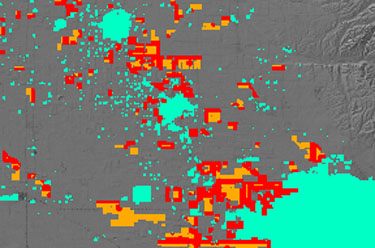
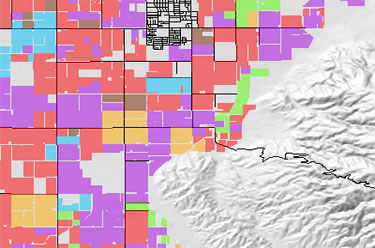
The Kern County Department Of Agriculture And Measurement Standards began digitizing annually permitted crop boundaries in 1997. Customized programming integrated the spatial data with tabular permit information to enhance the Department's ability to assess permitted acreage and proposed chemical applications on a site-by-site basis. Since 2000, local growers have worked with Inspectors to interactively map permitted sites through a customized GIS interface developed in the Department. Growers obtain a map atlas at the conclusion of this process. Growers and the public have access to the digital shapes, permit data, and use reports. The Department provides no technical support for these data. Problems with the download/unzip process should be directed to
agcomm@kerncounty.com. | |
|
| Notes: |
-
Data are available in ESRI format shapefiles.
-
Although every effort has been made to accurately locate crop boundaries, the Kern County Department Of Agriculture And Measurement Standards in no way guarantees the accuracy of these data.
-
To view a given year's data, right-click the year and save the file to your computer, then double-click the saved file and follow the prompts to extract its contents. If you encounter problems downloading or opening these files please email the department at agcomm@kerncounty.com.
-
Please consult the metadata provided with each file to answer questions about the contents - the Department provides no technical support in this area.
-
Multipart and duplicate polygons have been removed from each database. If you merge data, concatenating the pmt_site and pmt_year fields will uniquely identify each polygon in the merged database.
|
|
| Year |
Sites Mapped |
Sites Permitted |
% Mapped |
Rotation |
Interplants |
Multiples |
% Use Reports |
| 2021 |
14,156 |
14,156 |
100 |
Y |
Y |
Y |
100 |
| 2022 |
14,309 |
14,309 |
100 |
Y |
Y |
Y |
100 |
| 2023 |
14,581 |
14,581 |
100 |
Y |
Y |
Y |
100 |
| 2024 |
14,209 |
14,209 |
100 |
Y |
Y |
Y |
100 |
| 2025* |
14,236 |
14,236 |
100 |
Y |
Y |
Y |
--- |
| 2026* |
9,932 |
9,932 |
--- |
Y |
Y |
Y |
--- |
*Updated |
July 29, 2026 |
|
| Download all permitted shapes from 2021 through 2026 (11,667 KB). |
|
|
| NAD_1983_StatePlane_California_V_FIPS_0405_Feet |
| Projection: |
Lambert_Conformal_Conic |
| False_Easting: |
6561666.66666667 |
| False_Northing: |
1640416.66666667 |
| Central_Meridian: |
-118.00000000 |
| Standard_Parallel_1: |
34.03333333 |
| Standard_Parallel_2: |
35.46666667 |
| Latitude_Of_Origin: |
33.50000000 |
| Linear Unit: |
Foot_US |
|
| Geographic Coordinate System: |
GCS_North_American_1983 |
| Datum: |
D_North_American_1983 |
| Prime Meridian: |
Greenwich |
| Angular Unit: |
Degree |
|
|
|
|
| Year: |
Calendar year the database represents. Note that there will be sites for which the dt_act is before January 1 in almost every database, as growers begin to obtain permits in mid-December for the following year. |
| Sites Mapped: |
Number of individual polygons in the database for that particular year.
Each polygon represents a contiguous planting of one commodity in one section treated using the same cultural practices. The only exceptions to this rule are interplants and multiples, as explained below. |
| Sites Permitted: |
Total number of sites in the tabular database. Beginning in the year 2000 the number of spatial and tabular entries match one-to-one. |
| % Mapped: |
Ratio of sites mapped to sites permitted. |
| Rotation: |
Ability of the dataset analyst (you) to track change over time in the
spatial database. Beginning in the year 2000 each supplemented site throughout the year was entered into the spatial database on the same day we entered the new site into the tabular database. By querying on the dt_act and dt_inact fields the analyst can re-create the permitted site configuration for any given day during the year.
|
| Interplants: |
Cropping pattern in which one grower permits exactly two
commodities for the same piece of ground at the same time. This typically involves a
young permanent crop with another crop planted in the area between the rows. See the
metadata for the column s_status for more information.
|
| Multiples: |
Cropping pattern in which there are numerous small plantings on
one crop site. This typically involves a few rows of many different vegetables planted
too closely together to be individually digitized. You must consider this cropping
pattern when calculating acreage, as each different commodity/planting is assigned
the fully permitted acreage in both the spatial and tabular data. The spatial database
may contain a dozen or more polygons active at the same time for a particular location.
See the metadata for the column s_status for more information.
|
| % Use Reports: |
Indicates the percentage of pesticide use reports ( available here) that can be mapped
to the site polygons available for download on this page. Associate the
tabular use reports to the spatial data through the Pmt_Site
field.
|
|
|
|
| |